
Charting Change in Student College Planning Behavior
A comparative analysis of student survey results vs search activity behavior changes

Written by Steve Kania, Chief Technology Officer
Published on April 29, 2020
Activity from college bound students has been trending sharply down since the global pandemic began. Where is all of the web traffic? Did all of this activity simply shift a couple months? Will there be pent up demand that creates a tidal wave of traffic this summer? Or, is this the start of a new trend, a new normal, for higher education?
There have been many attempts to gauge the mental state of Gen Z, to predict how COVID-19 is going to change the class of Fall 2020, and all are well-intentioned. The dearth of surveys is noisy, though, and overlooks whether true changes are happening yet. Where the “true movement” stands is likely somewhere between the optimistic survey results and the 5-year lows of online college search habits; so getting a realistic pulse requires balancing these two results.
For example, Simpson Scarborough’s National Student Survey shows that 89% of high school seniors still intend to enroll at a traditional 4-year institution come Fall. In baffling contrast to that, we’ve seen fewer seniors returning to their Appily accounts during the months of April and March than in the past three years, but have had more new seniors register. All-in-all, the data is conflicting and provides fewer concrete answers than we’d all like.
Let’s look at the numbers to see what we’re truly recovering from, because the alteration in what is more than a 5-year pattern in some instances is a steep journey, one that will very likely take months to truly recover.
My approach to figuring out the state of affairs based around online search volume began by looking at specific important events during the college admission process to create a baseline of “normal” search volume. Many colleges have moved their decision deadline up exactly one month, so the search patterns should be easy to discern, just a single month ahead.
March is a particularly hard month to dissect because it encompasses a myriad of unique student events that all play into college search volume as well as milestones in the admissions process, but I chose several different areas to get as broad of a view as possible:
- General College Research Activity
- Acceptance Letters and Deposits
- Effects of Cancelling the College Entrance Exams
- Effects of Eliminating Spring Break Travel
At this point in time, all hypotheses will have to be formed as these abrupt changes happen, beginning with the first three weeks of March in comparison with historic Marches, and April will be treated the same way. Focusing in on the U.S. trend data from Google, each graph can be understood as follows: the highest volume day (whether over a period of 30 days, 1 year, or a decade) is considered the high traffic point (or 100%). All other points are represented in relation to that high point.
![]()
General Research is Generally Down — With One Caveat
Over the past five years, college search in March has stayed fairly steady. Never garnering the most traffic (that honor goes to the fall), but always taking a nice peak. At a glance, this year is a massive change from previous years.
Hitting a 5-year low, March 2020 is close to a 50% drop from norms. For institutions concerned about whether or not this is affecting just their institution, the answer is a resounding “no.”
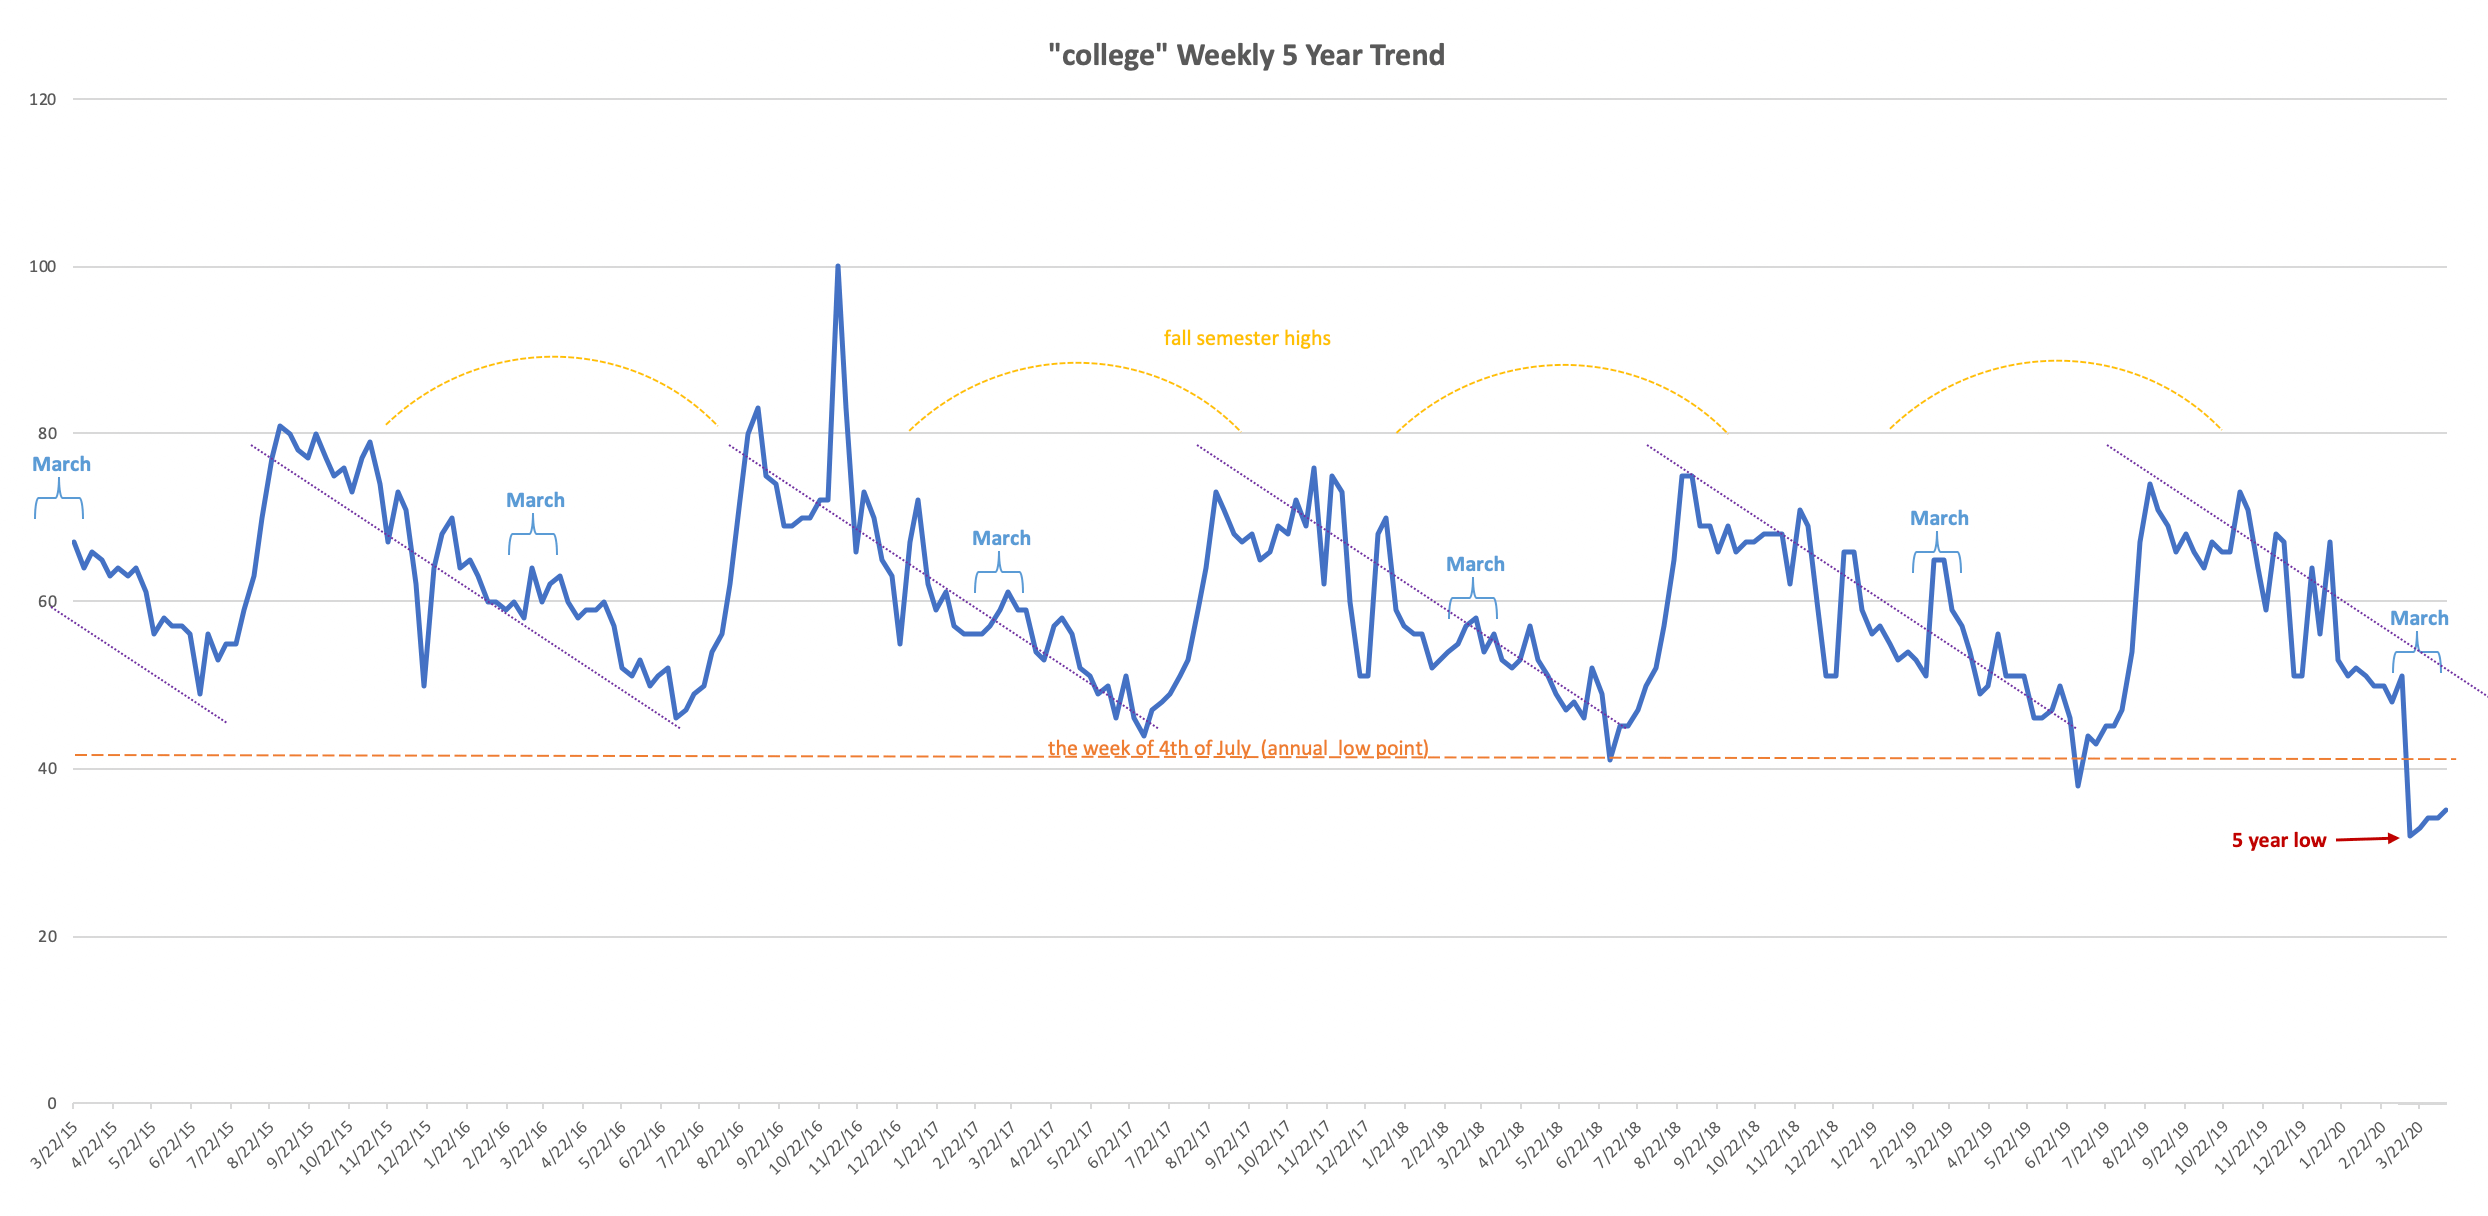
April volume hasn’t returned to normal, by any stretch, but it’s bounced off the floor and is trending slightly upward. This isn’t totally surprising — April has been more fortuitous for many colleges, with virtual campus tours finally spiking some interests as institutions rush full speed ahead with digital marketing methods.
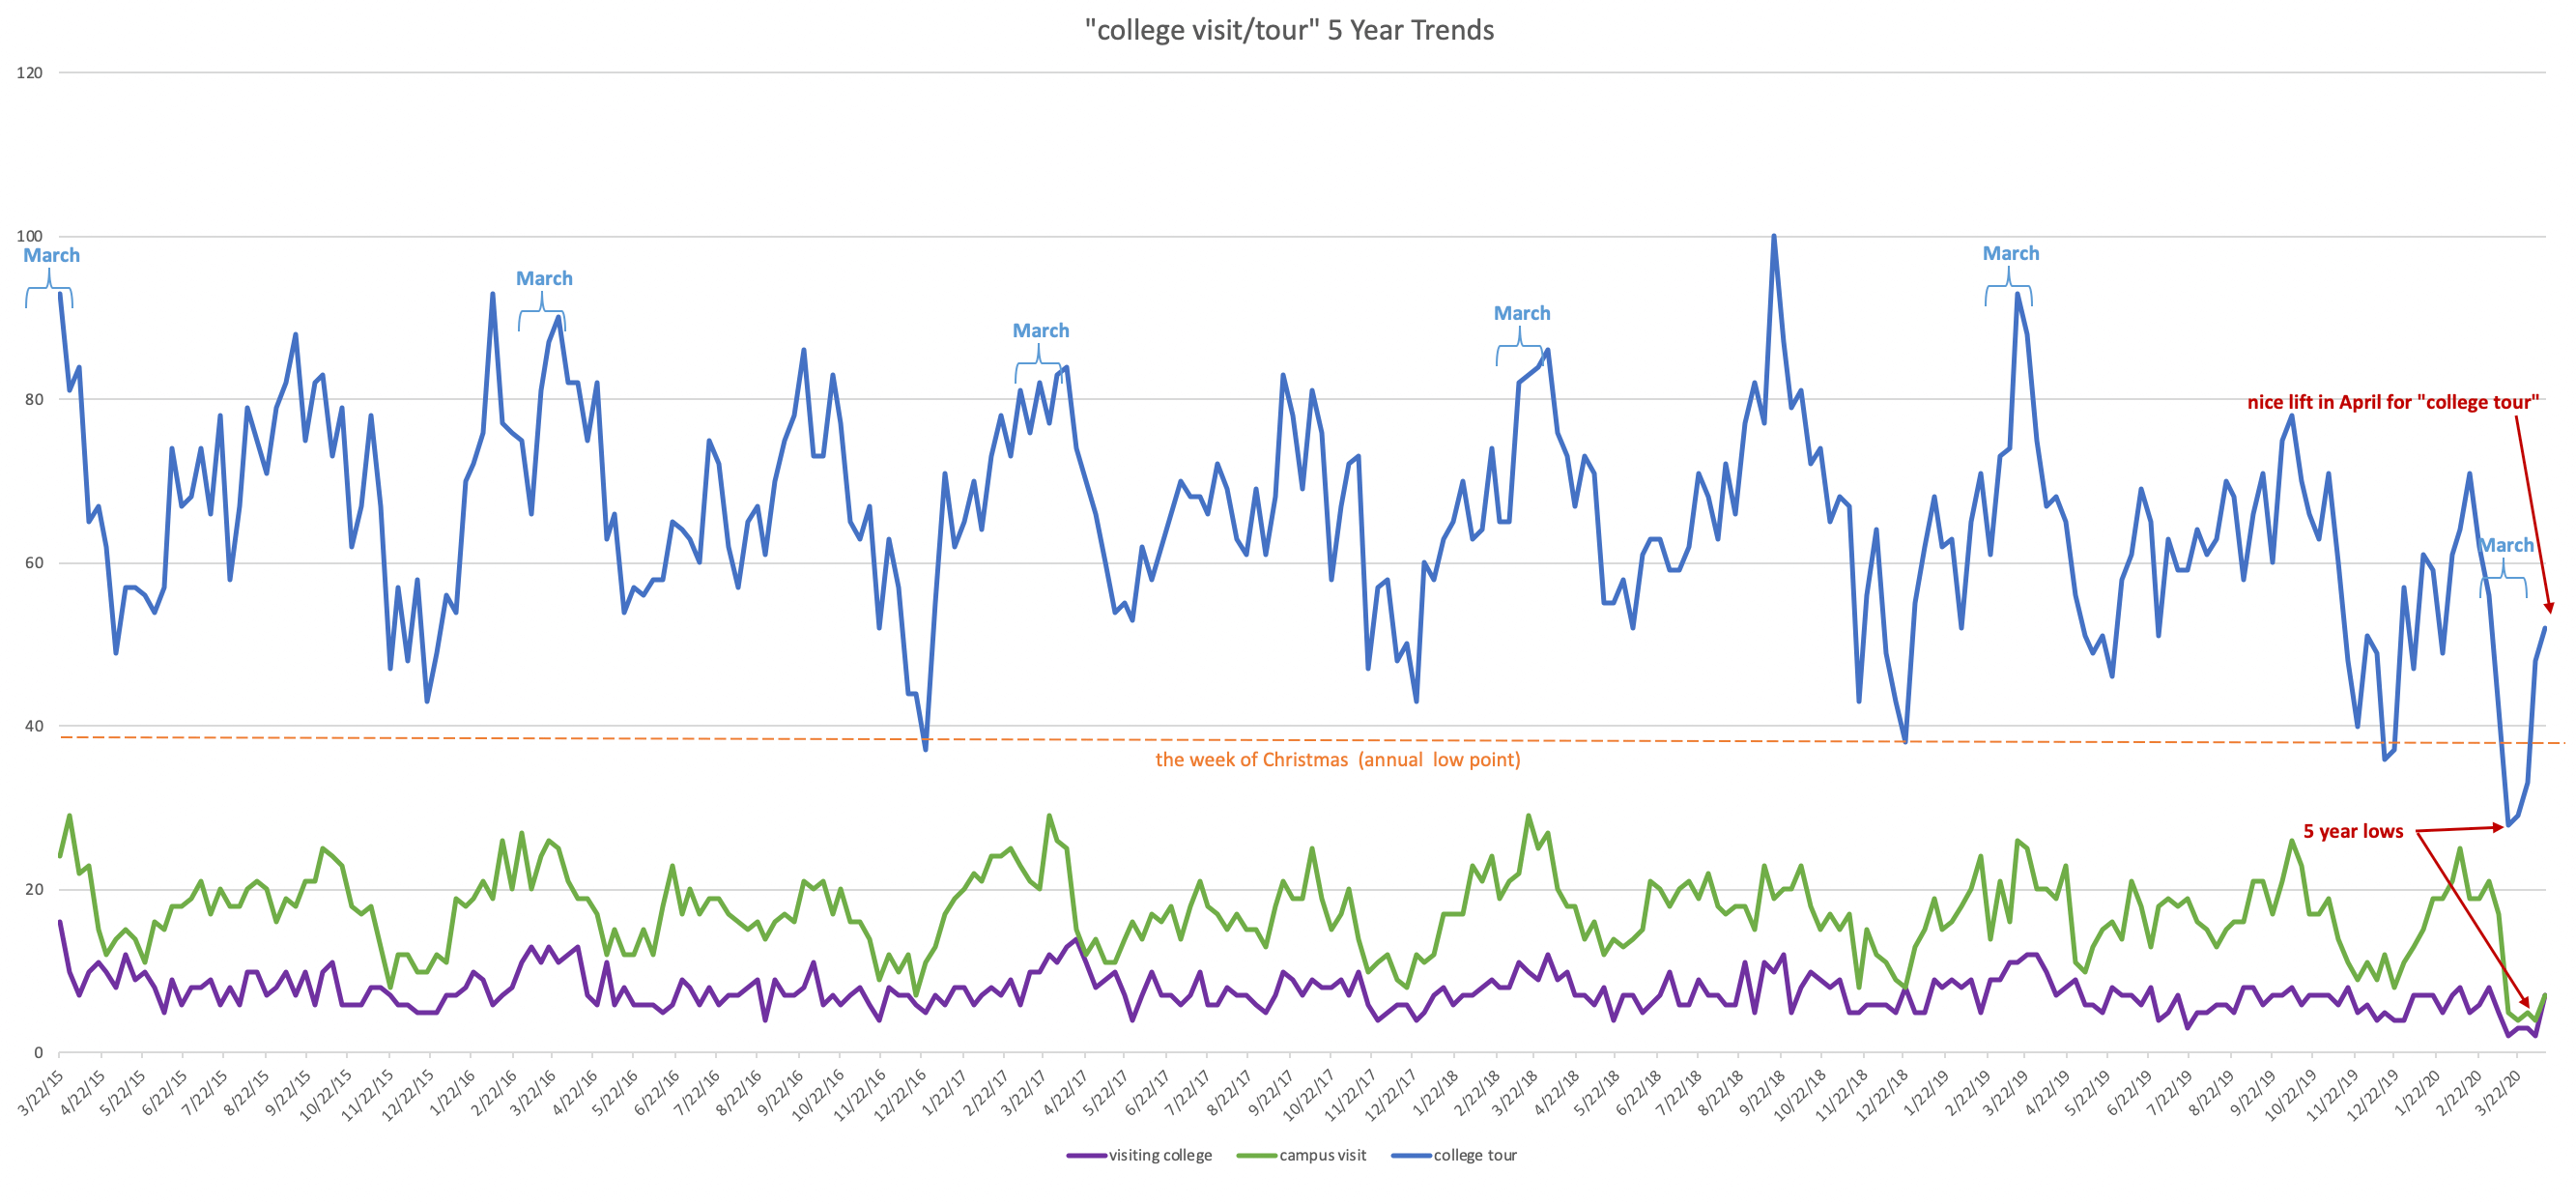
Where “campus visit” and “visiting college” only had mild upticks in April, “college tour” skyrocketed as students search for ways to virtually get a feel for college and university campuses.
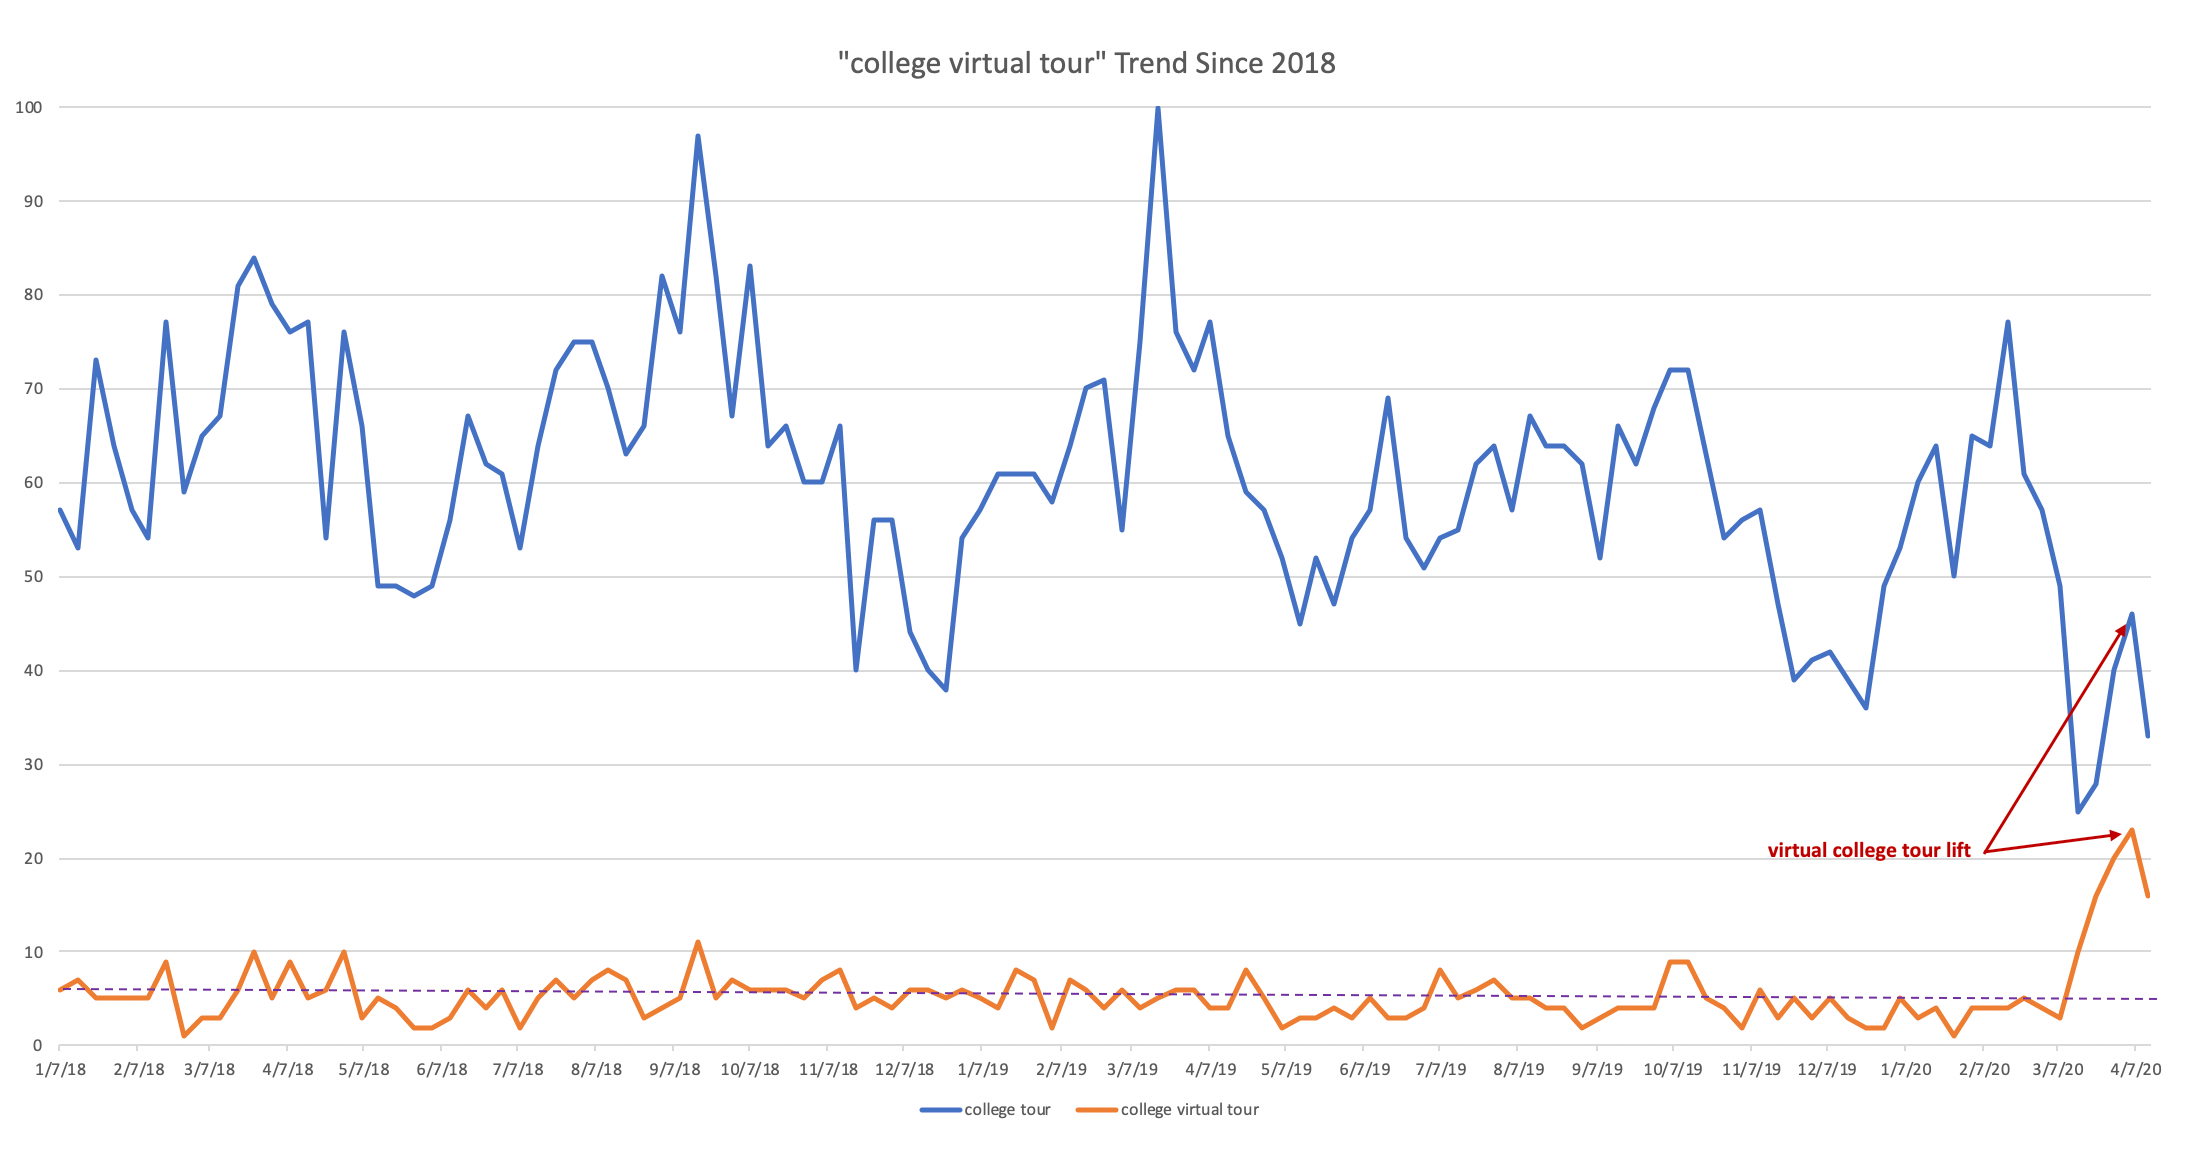
Breaking it down even further in the graph above, you can see the true value of the virtual college tour in the search traffic. While this isn’t a replacement for on-campus visits, it shows that the research pulse is starting to beat again.
![]()
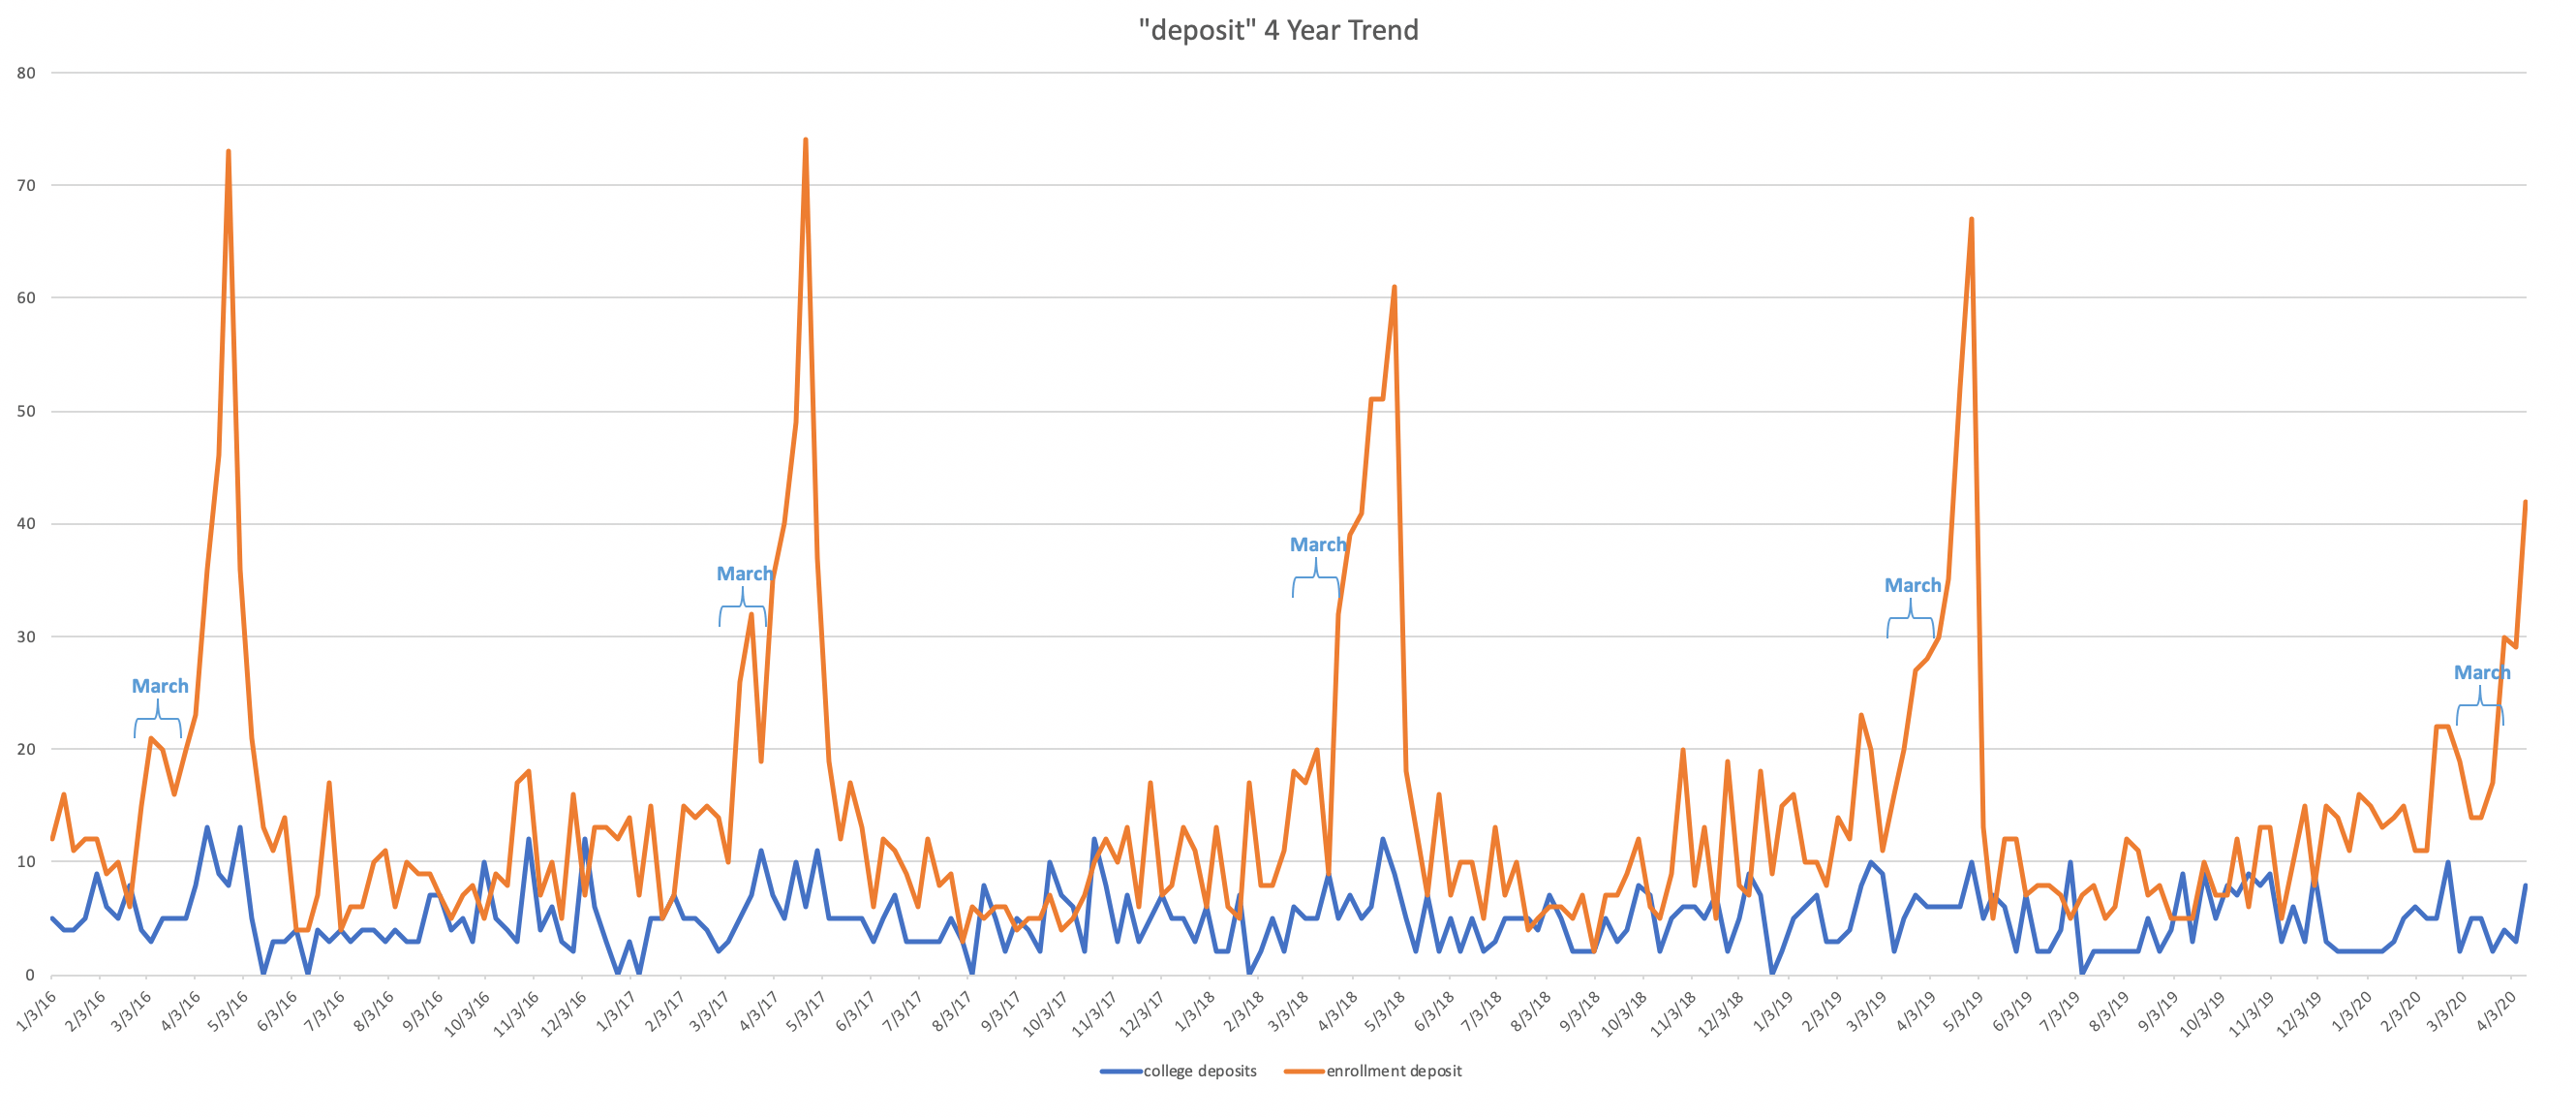
Higher Unemployment Rate Equals More Concern over Deposits & Tuition, Not Acceptance
Acceptance letters play a large role in search traffic during March and April, as we see undecided seniors performing last-minute research on their acceptances, while also trying to make sense of waitlist and rejection letters. Between these enrollment letters and subsequent financial aid letters, search traffic hits a natural high during March and April.
Following in the stead of general college research activity, though, searches regarding acceptance letters and deposits is also at a 5-year low.
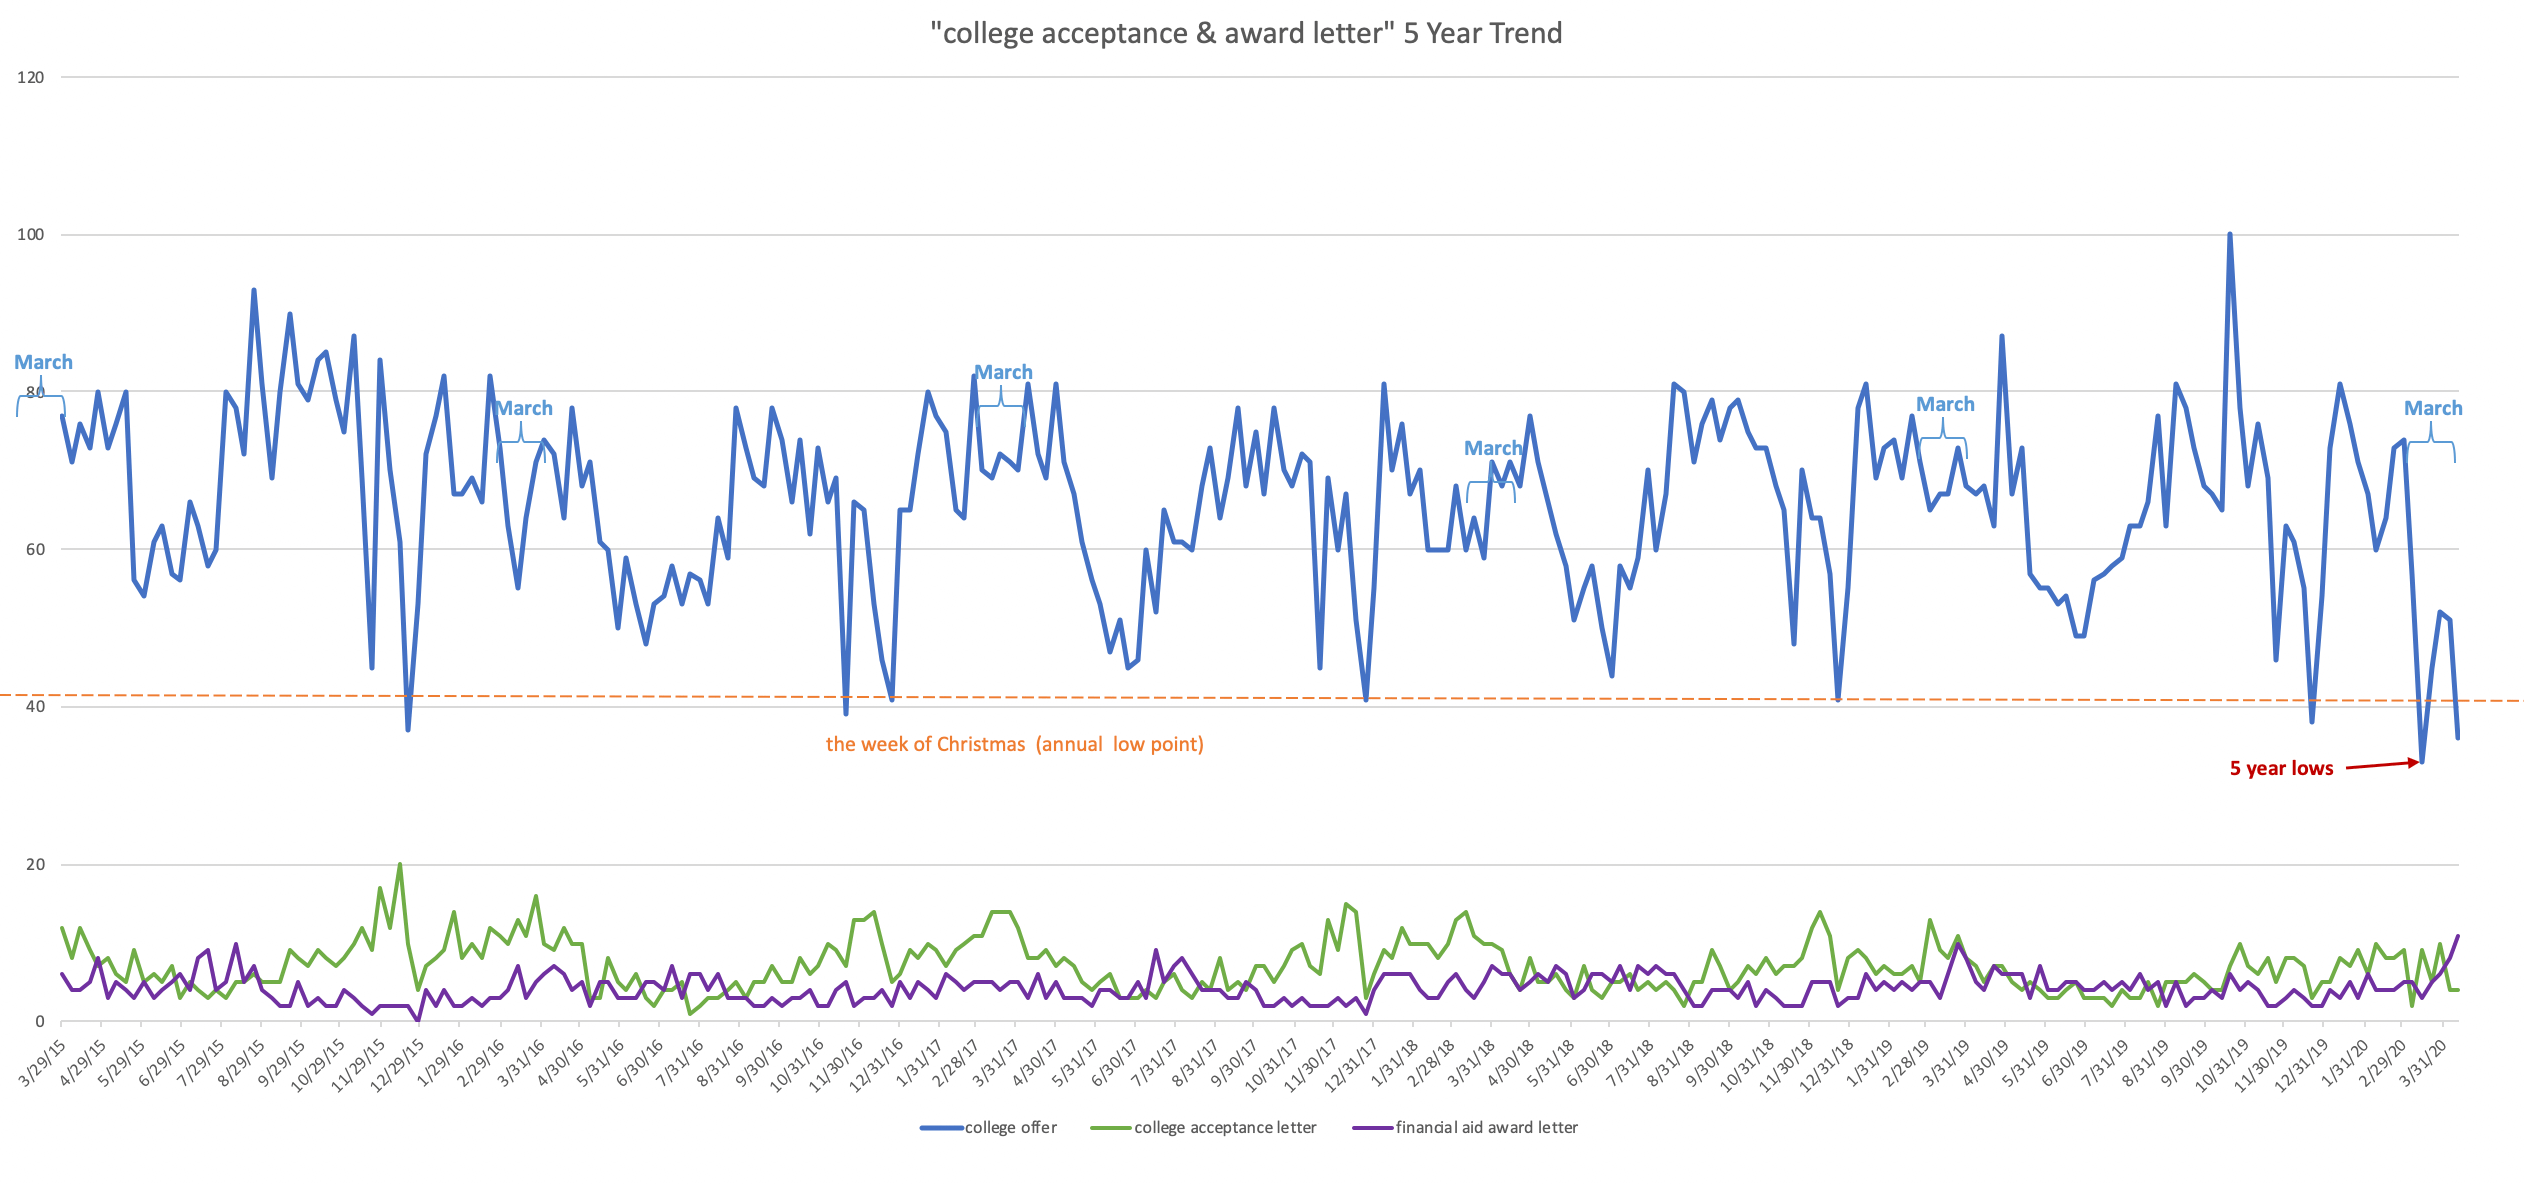
And it’s the same no matter how you spin it. It’s around this time that we’d expect to see a spike in searching as students prepare to make their final decisions, whether for May 1st or June 1st.
One thing to note in the above graph is that the one search bucking the trend is for “financial aid award letter” indicated by the purple line. Defying all other search activity, it’s actually exceeded the typical search volume for this term.
In the same vein, searches on college deposits have bounced up — not to their usual search quantity, but more remarkably than many other data points. We may see this search term rise higher still as we get closer to the extended deadlines for deposits around June, once families have had additional time to make their final choice and come up with the deposit.
This is incredibly reflective of the current time. According to the Princeton Review College Hopes & Worries Survey, back in 2006, the biggest worry for students and parents was about getting into their top choice college. Now, the worry has changed from paying for the top choice college to worrying about the debt incurred for any degree.
Compound that with the 22 million Americans who’ve filed for unemployment in the past month, and it’s not surprising at all that searches are focused on financial aid and award letters. It’s likely that this more than anything else will impact students’ ability to attend higher education come Fall 2020.
Is This the Beginning of the End for Standardized Tests?
The most popular time for juniors to take the ACT or SAT for the first time is in the Spring. With the April and May test dates cancelled, and now the June dates, it’s uncertain when there will be another test date. CollegeBoard has announced plans to debut an at-home version for Fall, but, in the meantime, traffic is limited to checking cancellations. However, search activity is climbing for another term — test-optional.
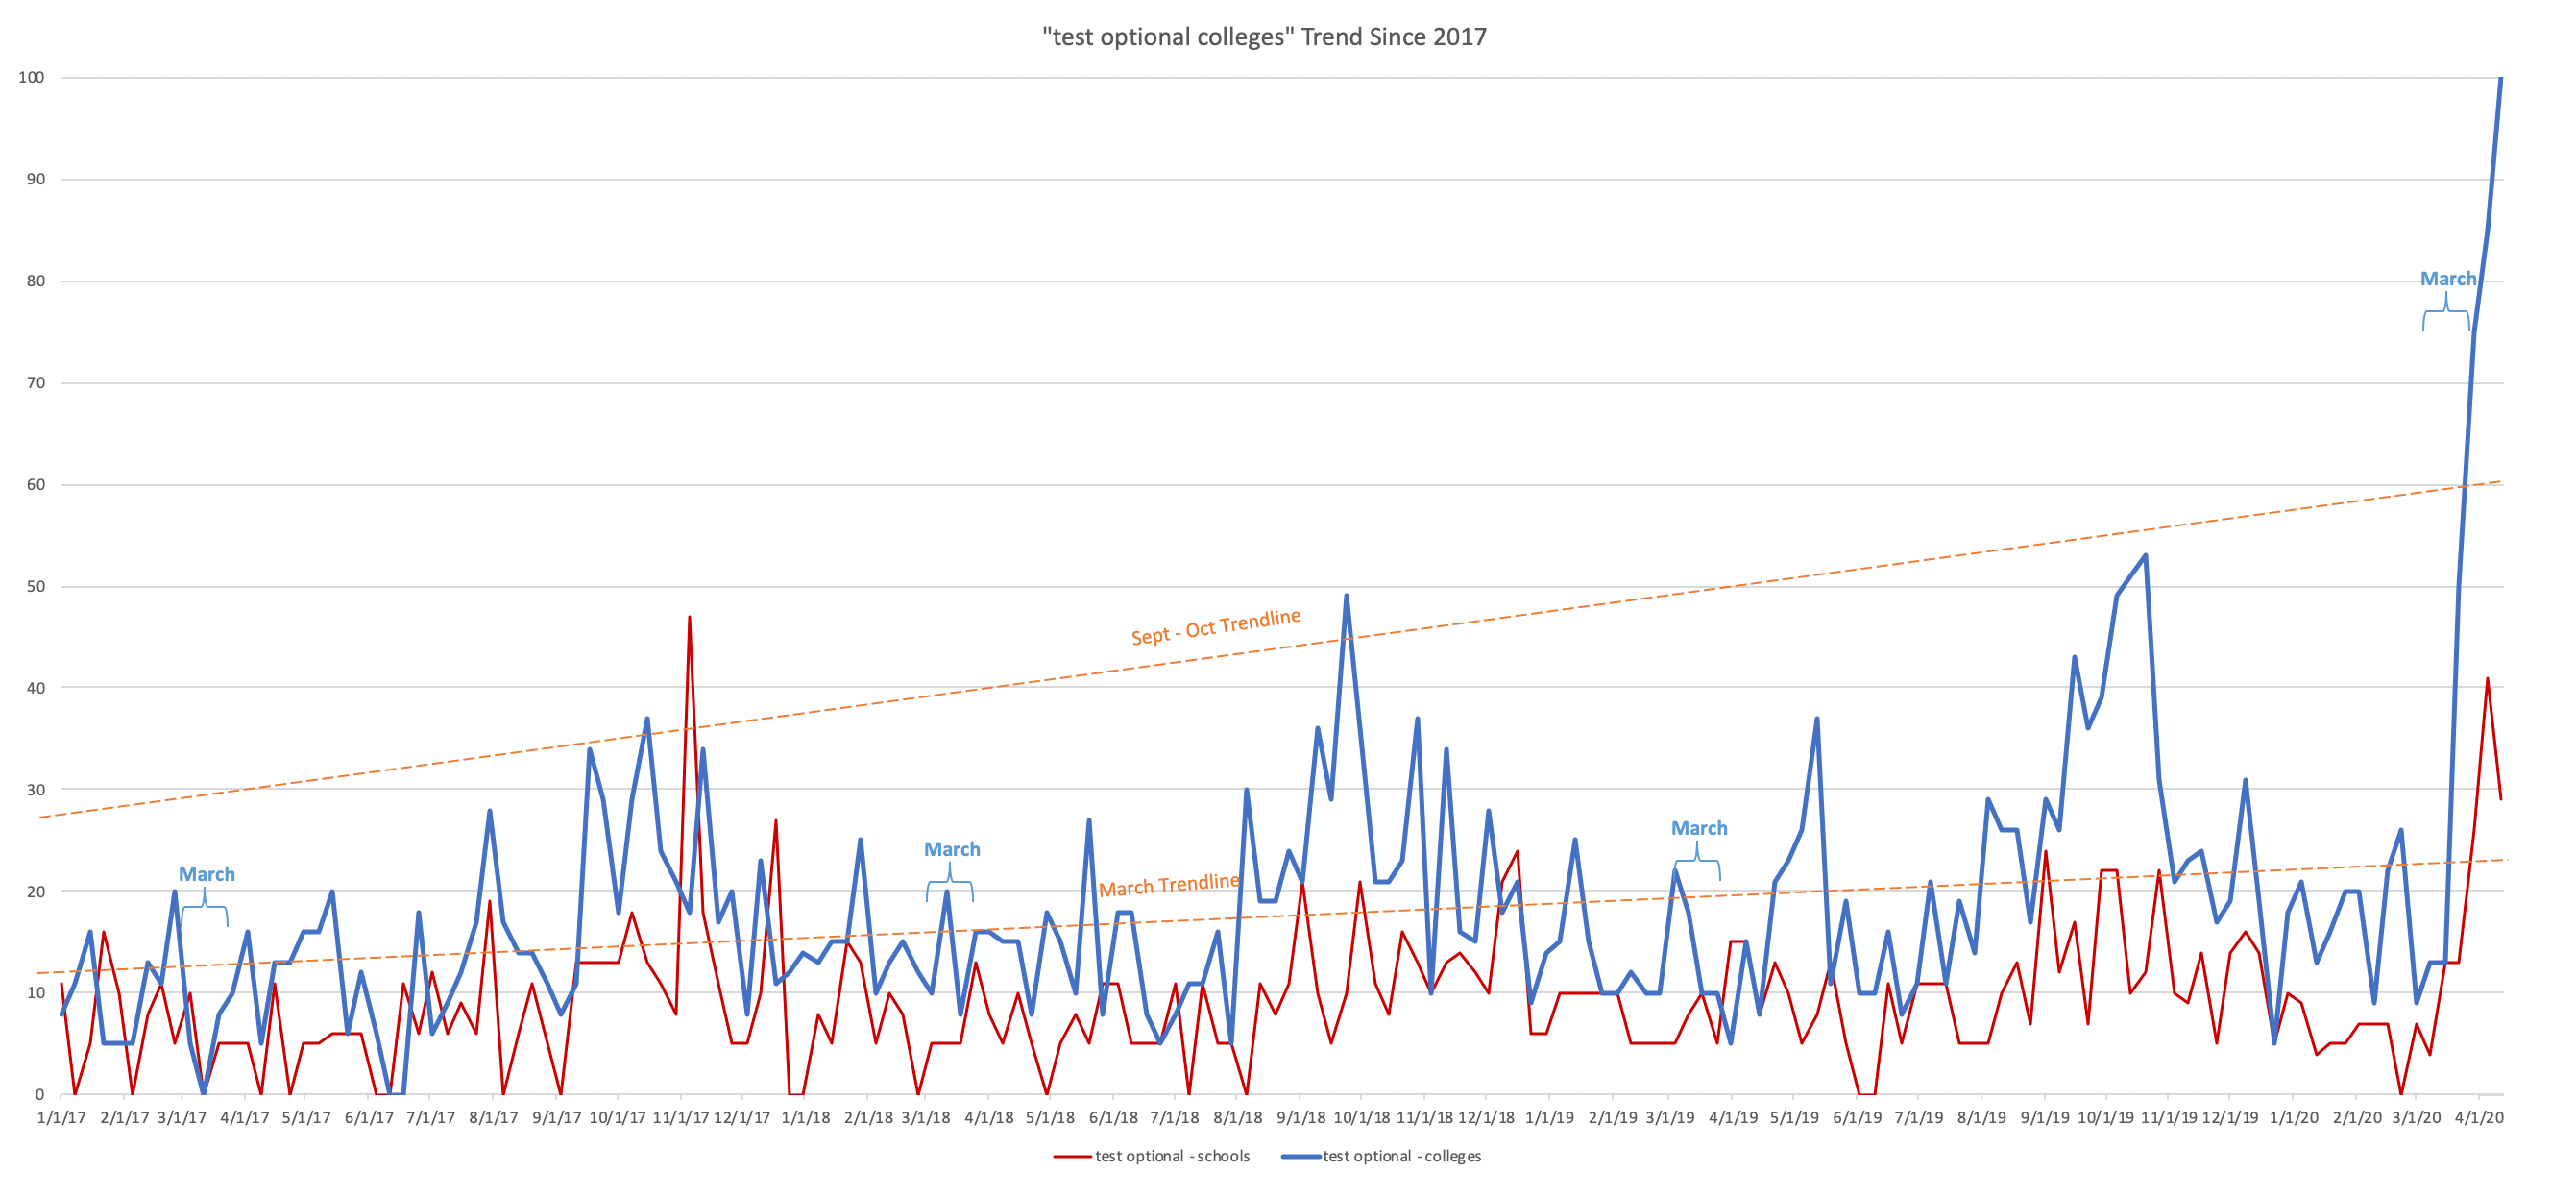
With the concerns and dissatisfaction floating around about the quality of virtual education, there’s true concern about what sort of scores students will receive on standardized exams.
One plan that colleges are exploring is either permanently or temporarily going test-optional — and it’s clearly a popular option if the incredible surge in search traffic says anything. Large, prestigious schools including the University of California System are joining the test-optional trend, a surprising but not unprecedented addition to the list.
Each year, there has been a growing interest in test-optional colleges, so the real question is whether or not COVID-19 will accelerate that interest.
Eliminating Spring Break Travel Eliminated a Huge Decision-Making Experience
The novel coronavirus has derailed the end of senior year for many high school seniors, many of whom are sharing their online disappointment about cancelling their planned college stops during Spring Break. For admitted students, this was a final chance to get a firsthand experience of campus life before committing to a school. For juniors, this is often the time families first venture out to explore colleges as they kick-start their selection process.
I explored the broadest geographical search during March and April identifying key search terms including derivatives of “colleges in,” to isolate the pre-planning college visit behavior that we see peaking every year around the same time— except for this year.
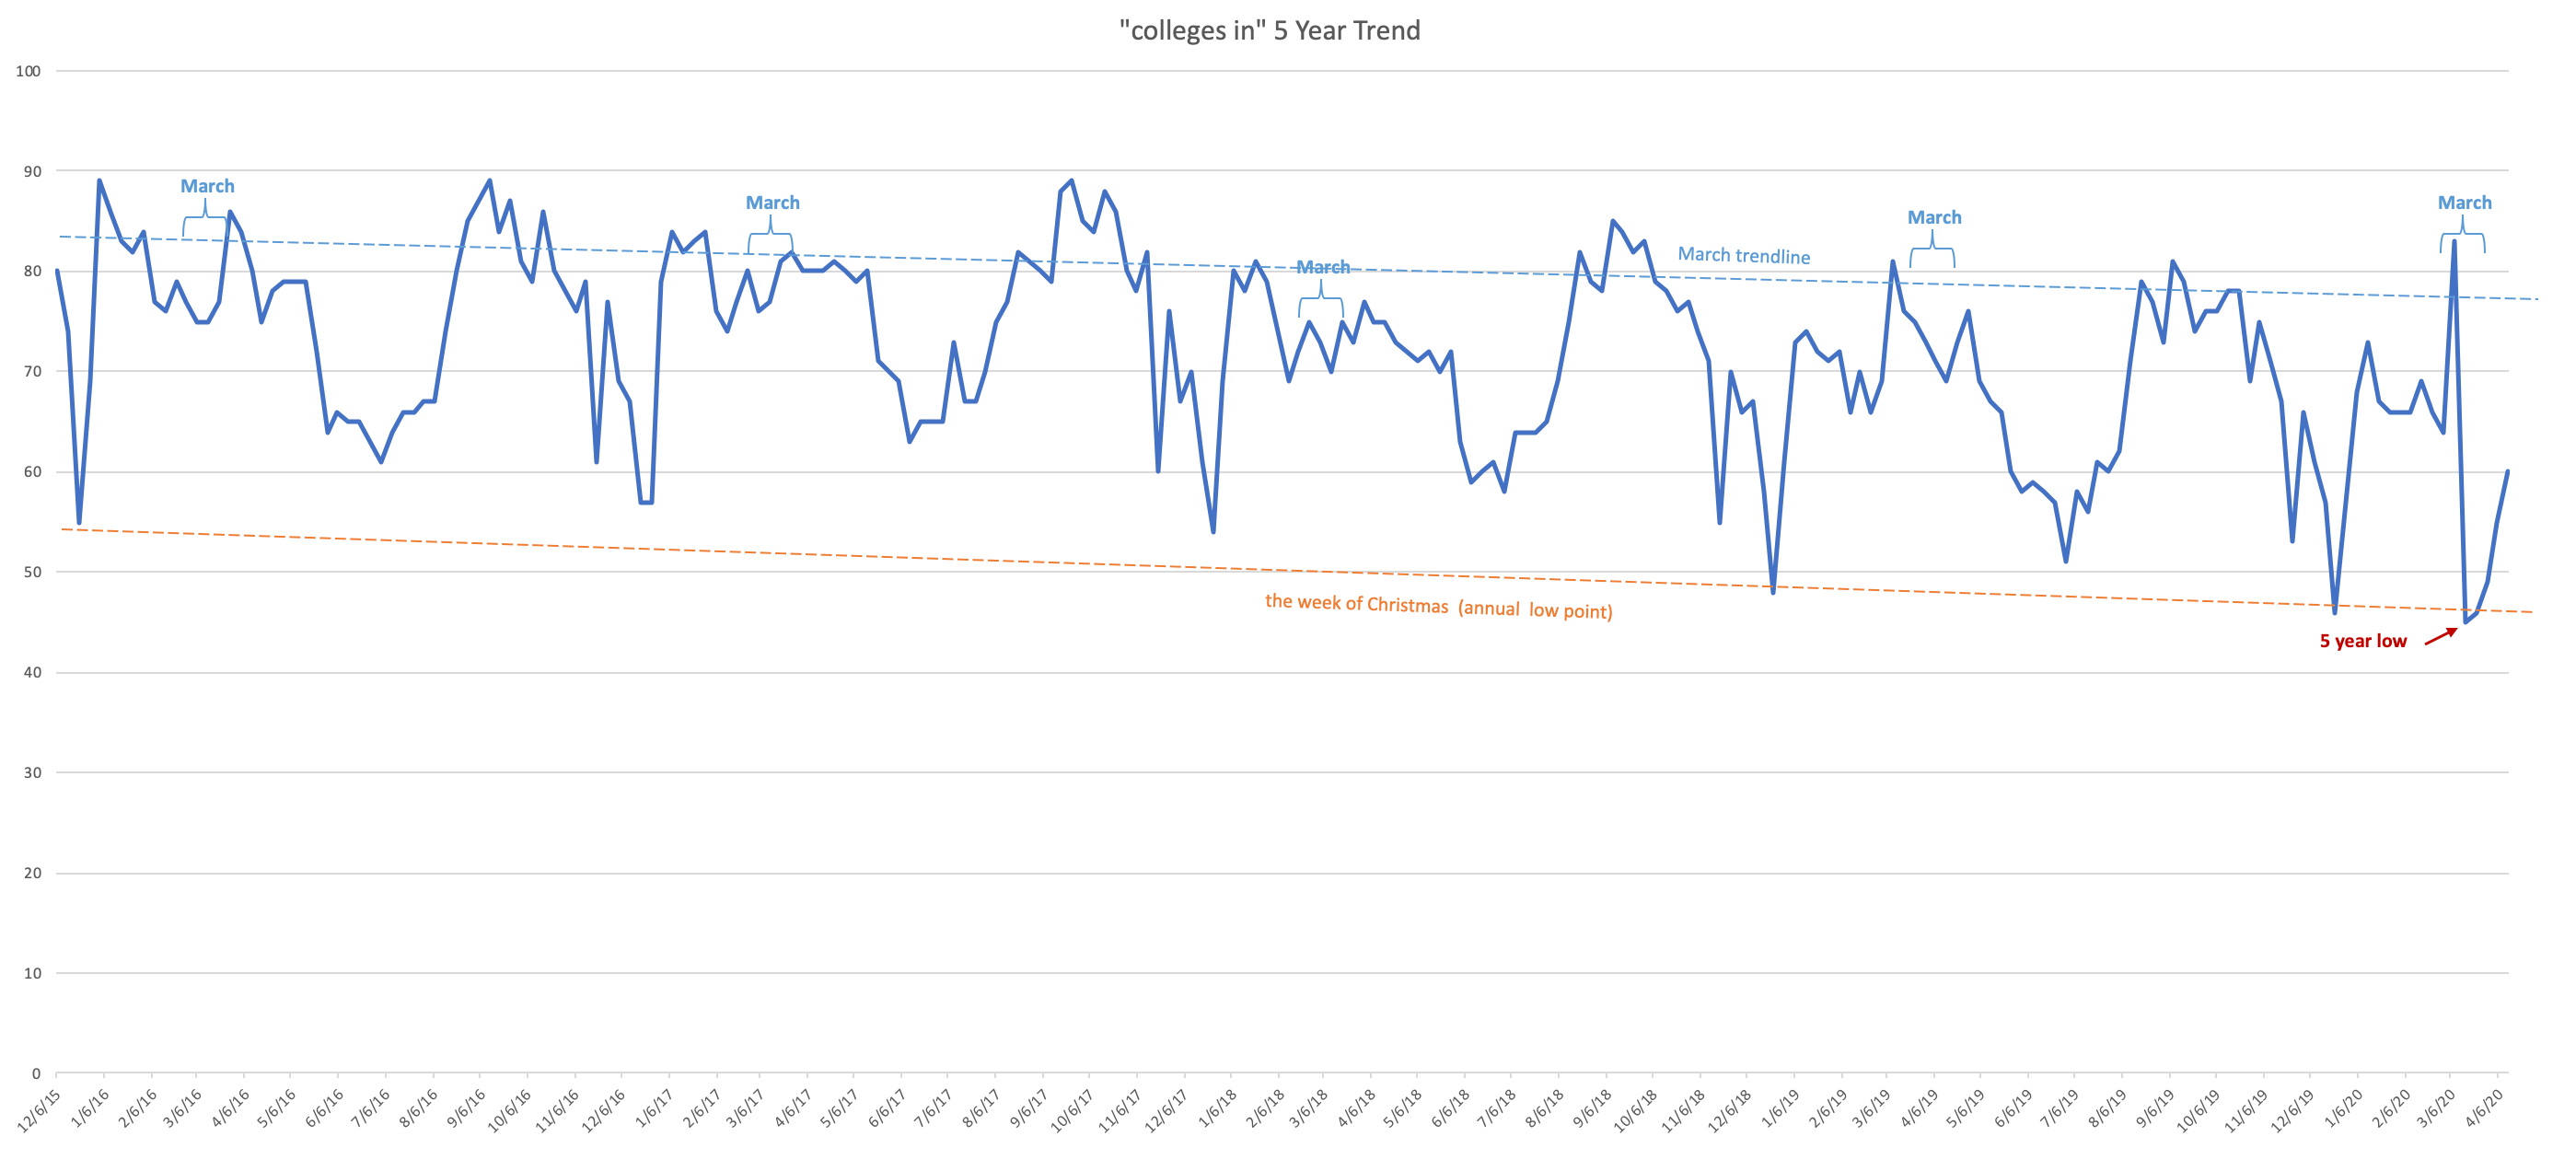
The above chart shows pops of volume in the fall, with strong volume around Spring Break, with the winter holidays (end of December through New Year’s Eve) as the consistent low point. March has some disheartening results. Like many other search stats, we’re looking at the lowest volume in the past 5 years.
Redoing this search in April, though, there’s a change — the search traffic is slowly creeping up.
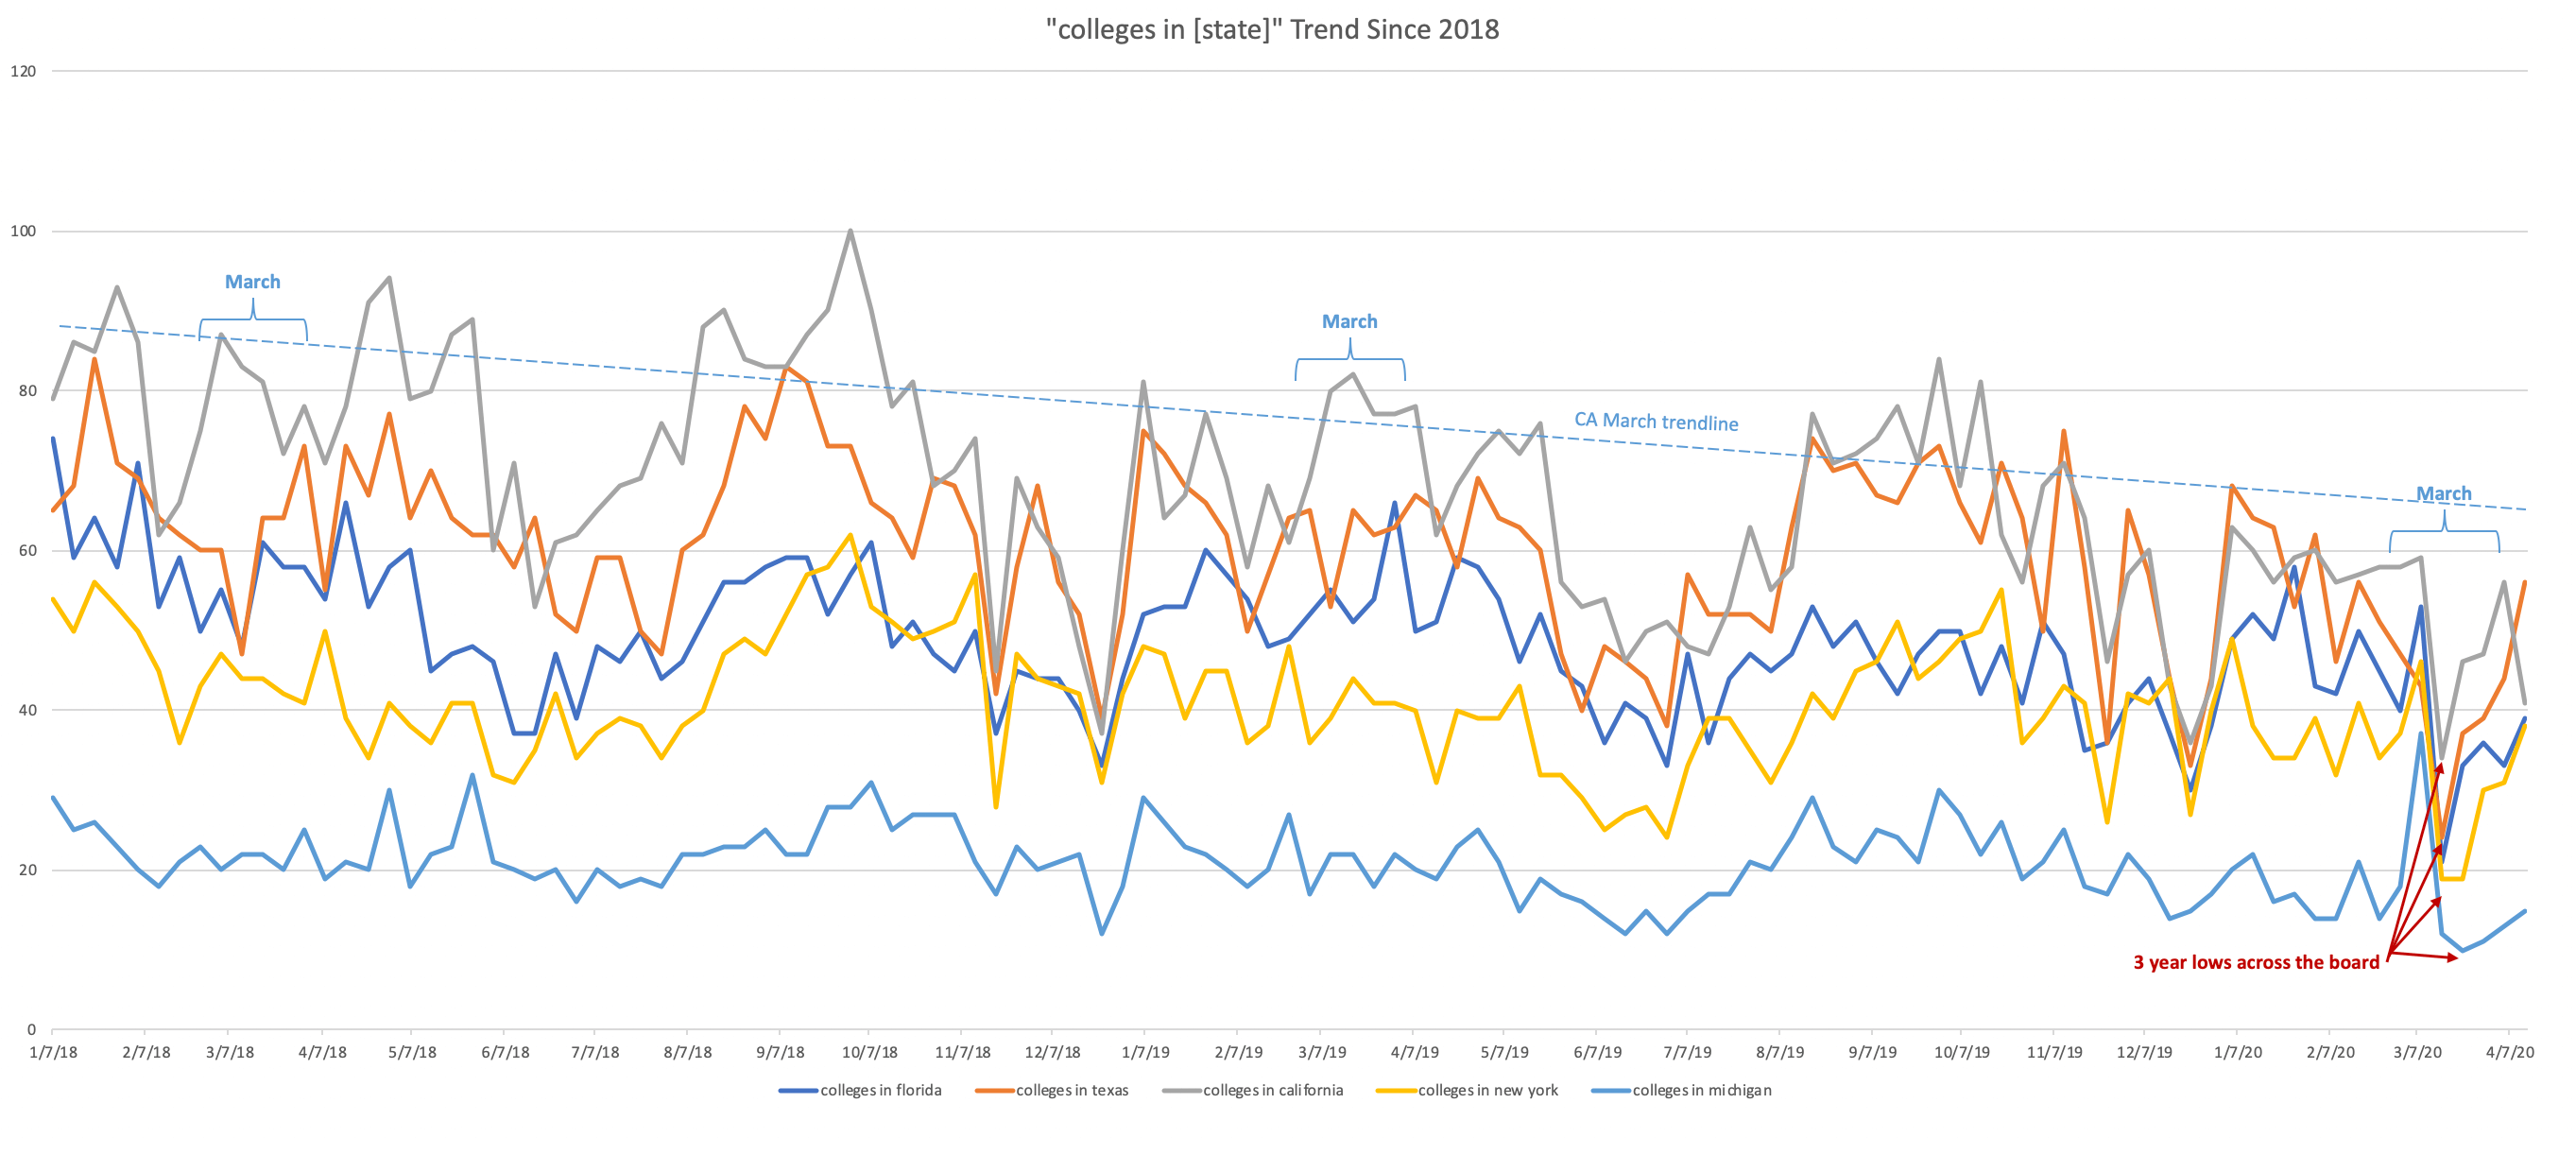
Using Florida, Texas, California, New York, and Michigan as examples, we can see a stratified breakdown of the same pattern we saw nationally. March showed the same all-time lows hit every state, but there was a surprising jump up in April. Not back to “normal,” but we could call it a semblance of normal. The only state that seems not to have recovered in any significant capacity is Michigan.
No Sweeping Shift to Search for Online Universities … Yet
Despite all of the dramatic drops in the traditional college search terms above, a keyboard and monitor have yet to replace the classroom atmosphere, student social events, or a walk through the quad.
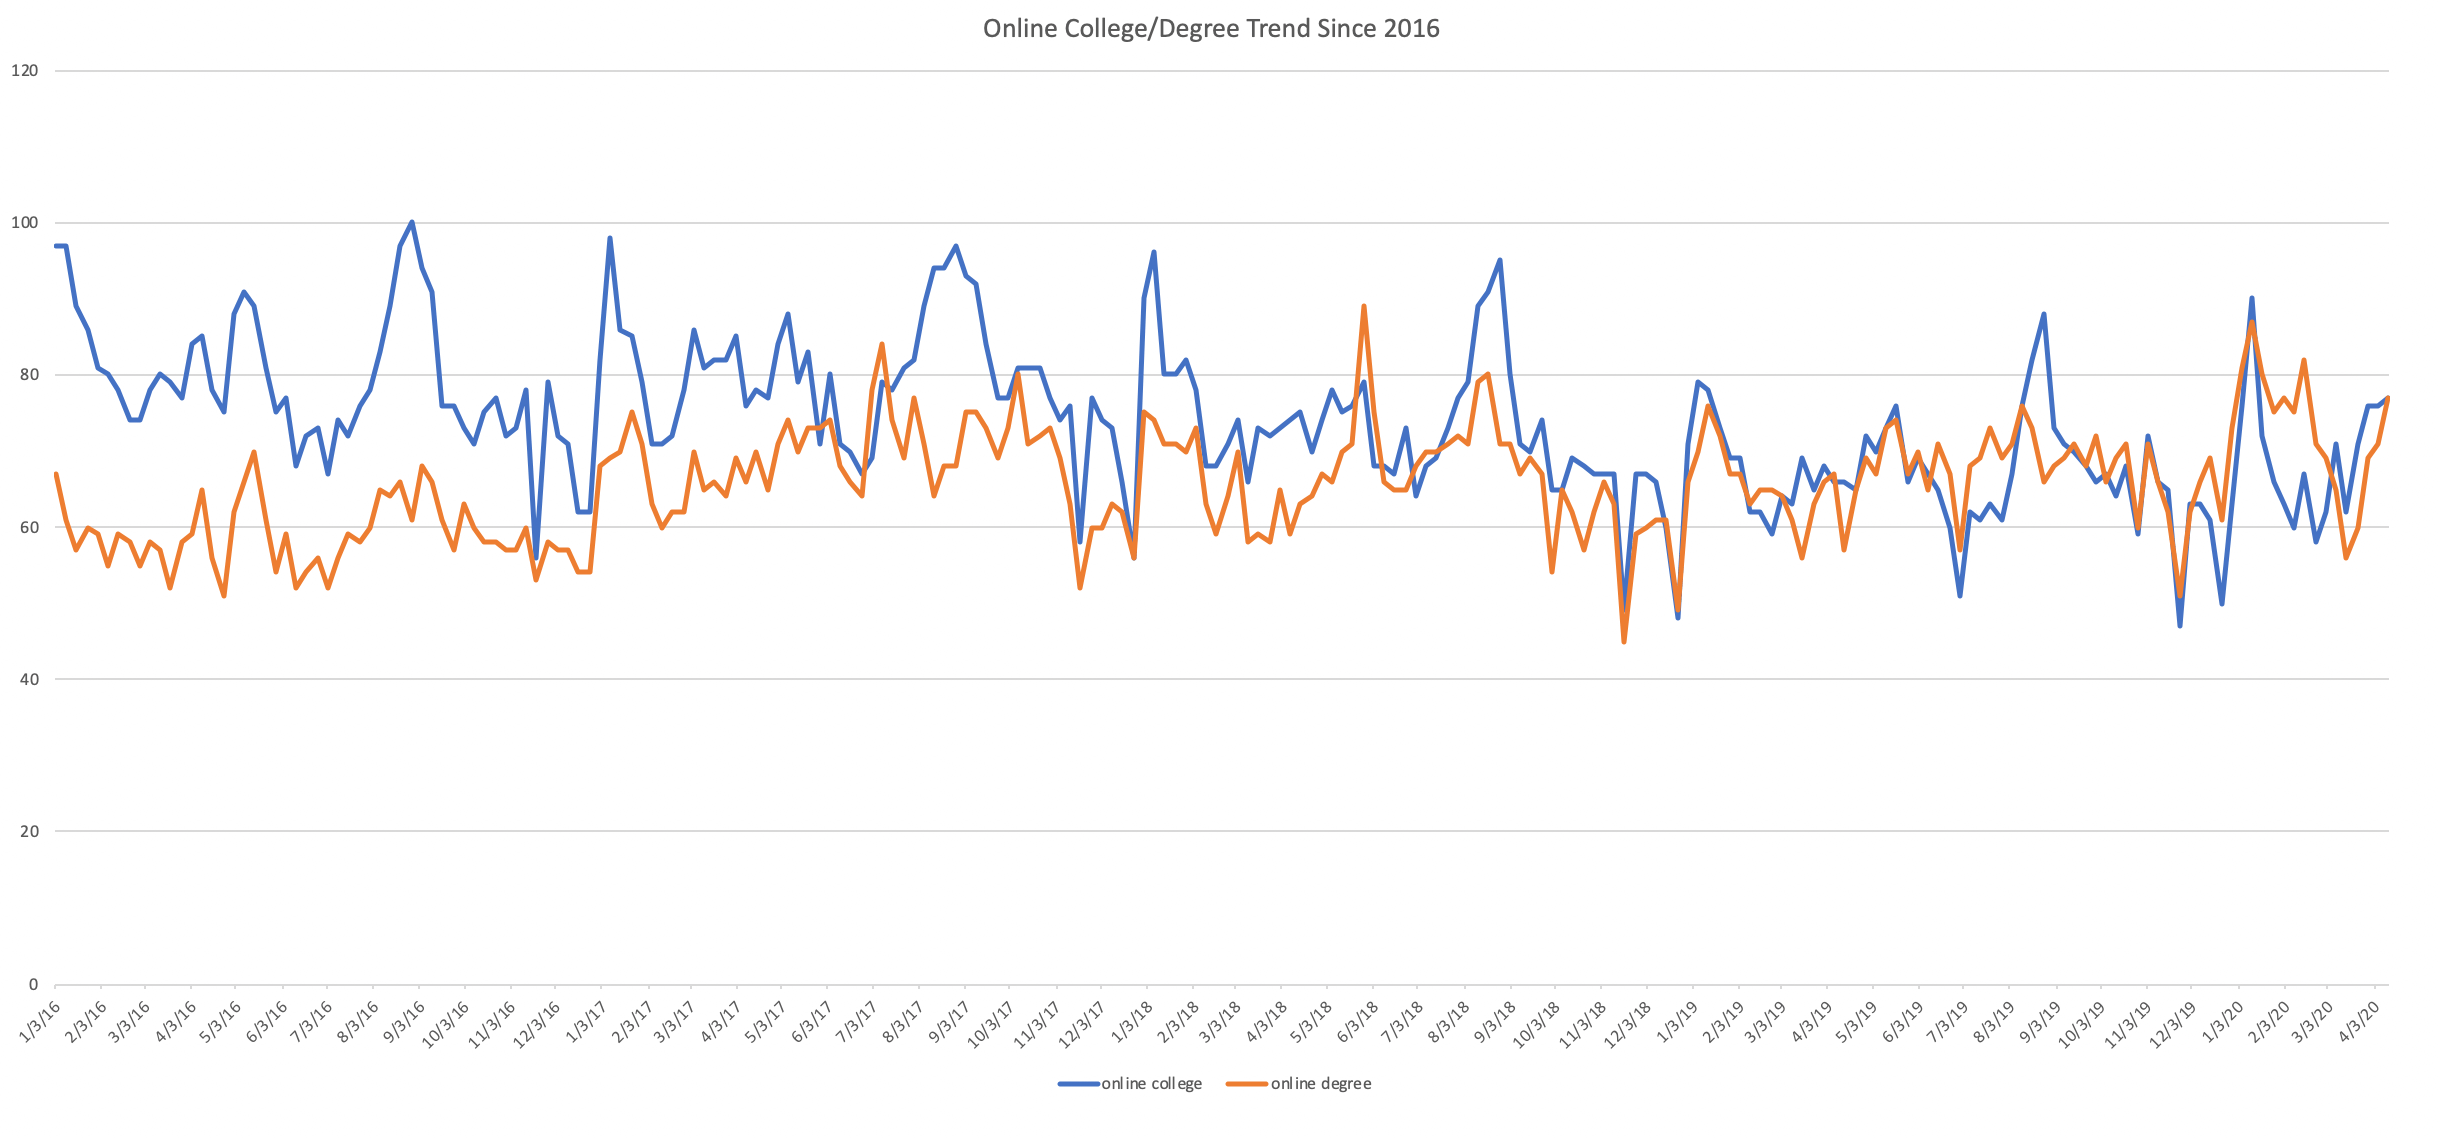
Search for online colleges and degrees remains stagnant, even when the possibility of class on campus in the immediate future is uncertain.
As sort of a word of caution to go along with this, though, there have been several surveys to gauge the direction of the wind on this matter. While the search for fully online colleges may not be showing spikes, we likely won’t see true results on this until August.
Even now, though, there’s been a heavy spike in students who would be open to learning virtually or considering full-online degree programs. An April 2020 Student Survey from PLEXUSS shows that, “Prior to COVID-19, 82% [of students] wouldn’t have considered [fully online learning]. Now, only 29% are not open to full online delivery or otherwise would not consider it.”
While that may not mean that students are ready to enroll at a college or university that solely does online learning, it means that they’re looking for institutions who have the familiarity with it and are prepared to handle virtual education with some sort of finesse.
![]()
No Definitive Patterns Confirming a Change in Student Behavior
There are a lot of factors at play that affect college-bound students every March and April. This year, all of us were thrown a Hall of Fame-style curveball and there are moments that we’ll never be able to recapture, but people are both resilient and quick to adapt. How they adapt, though, is yet to be seen. While several search terms are inching slowly upward, the financial impact of COVID-19 is yet to be seen, and there is no definitive pattern between the dearth of qualitative student survey data that is confirmed with quantitative shifts in search.
While this likely isn’t the result that anyone wants, there are simply too many moving factors to conclude a clear behavior change. The next milestone that may provide a bit of insight is May 2nd — the day after the Reply By deadline for colleges that opted not to extend. How many students will confirm enrollment?
On trend, the disillusioned, concerned, frustrated Gen Z is even harder to predict in this unpredictable time.